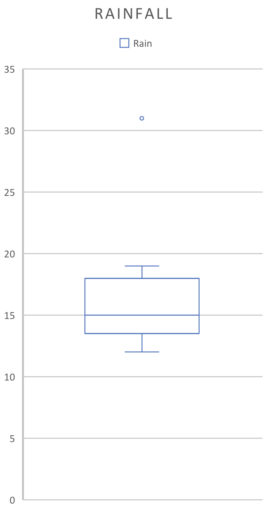
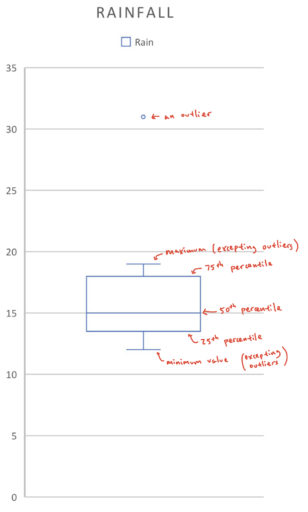
A box plot is so named for its iconic shape:

(They can also be laid out horizontally). The parts of the graph correspond to:

Looking at a box plot can give you a quick sense of what the distribution of the data looks like. For example:
Example 1
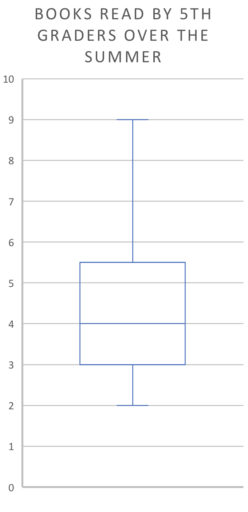
Find the 25th percentile, 50th percentile, 75th percentile, range, and median for the below boxplot:

Answer
The 25th percentile on a box plot corresponds to the bottom segment of the rectangle, in this case 3. The 50th percentile is the line in the middle of the rectangle, here 4. And the 75th percentile is the top line of the rectangle, in this case 5.5. Now, the ends of the rectangle (the "whiskers") generally correspond to the most extreme values of the box plot, unless there are outliers (values that lie beyond the whiskers). We don't see any outliers here, so the range is found by just subtracting the whiskers: $9 - 2 = 7$. Finally, the median is just the 50th percentile, which we have already found is 4.
Example 2
The following chart represents the books read by the 500 fifth-graders in a school over the summer. Suppose no student read exactly 4 books. How many students read more than 4 books?

Answer
We know that the median is 4, from the above graph. Since no student read exactly 4 books, we know that exactly half of the students must have read more books and half must have read fewer. Thus, we conclude that 250 students must have read more than 4 books.
Example 3
The following chart represents the books read by the 500 fifth-graders in a school over the summer. What is the approximate number of students that have read between 3 and 4 books?

Answer
We know that 3 is the 25th percentile and 4 is the 50th percentile. So about 25% of the students read between 3 and 4 books. Thus, we conclude that about 125 students read between 3 and 4 books.
Practice Problems
-
The following chart represents the books read by the 100 fifth-graders in a school over the summer. What is the approximate number of students that have read more than 5 books? (We assume that people can only read positive integers of books).

Answer
We know that 5.5 is the 75th percentile or third quartile. Since nobody reads 5.5 books, we know that a fourth of the students have read 6 or more books. Thus, we conclude that about 25 of the students have read more than 5 books.
-
The following chart represents the books read by the 500 fifth-graders in a school over the summer. Suppose 7 is the 80th percentile of this data. Approximately how many people read between 6 and 7 books? (We assume that people can only read positive integers of books).

Answer
We know that about 25% of the students have read more than 5 books, given how the third quartile line is placed. Since 7 is the 80th percentile, we know that about 20% of the students have read 7 or more books. Thus, about 5% of the students have read between 6 and 7 books. Multiplying by 500, we get 25.
- Researchers measured, over 36 months, how often it rained in a month. About how many months had rain from between 13 and 18 days?

Answer
We see that 13 and 18 are approximately the first and third quartiles respectively. Between them lies about 50% of the data, so we conclude that about 18 months had rain from between 13 and 18 days.


